

Can you trust comparable sales when a house is a wreck?
You can, but only if you stop using distressed comps and start matching the post-rehab home, document the current damage, and tie every adjustment to contractor bids.
This intro shows the practical steps to assess ARV for distressed residential properties using comparable sales analysis and how to pull tight-timeframe comps, match beds/baths/square footage, adjust for finishes and lot, and produce low, likely, high ARV tied to rehab costs.
Read on for the quick screen and the common red flags.
Core Methods for Determining ARV on Distressed Residential Properties
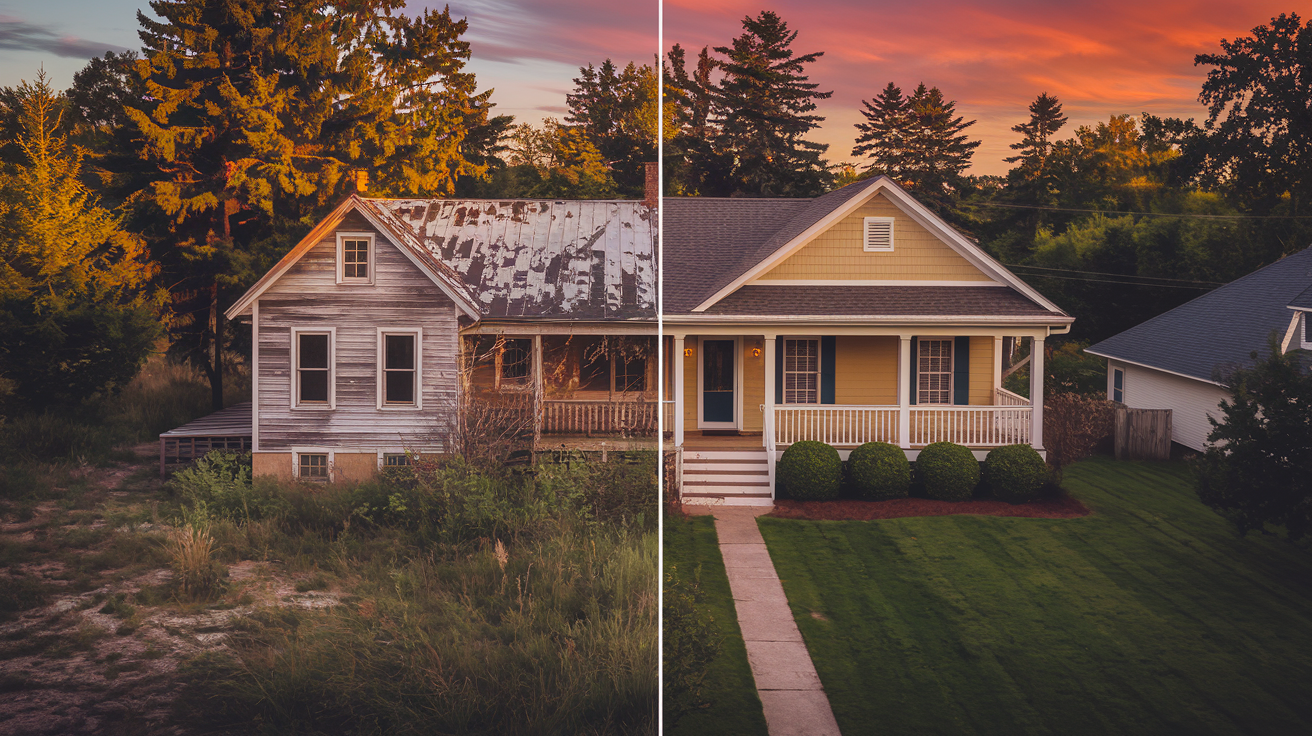
After-repair value answers the only question that matters when you’re staring at a distressed property: what’s this thing worth when the work’s done? Without a solid ARV, you’re guessing on purchase price, you don’t know if your renovation budget fits, and you’ve got no idea whether there’s profit left after holding costs and resale fees.
The ARV formula looks simple: current market value plus the value your renovations add. But here’s the thing. Current market value isn’t your purchase price. Foreclosures, auctions, and desperate-seller deals come in below market all the time. The renovation value-add is what you gain in sale price from specific improvements. Say a house sells as-is for $200,000. You spend $40,000 on renovations and now it’s worth $260,000. Your ARV is $260,000, and the renovation added $60,000 in value. The rule is straightforward: your total renovation costs have to stay below the value-added, or the deal doesn’t work.
Distressed properties mess with how you pick comps. You’re not looking for move-in-ready sales. You want recently renovated homes that match what you’re targeting post-repair. If your subject property’s got foundation issues or ancient plumbing, those problems tank current value but disappear from the ARV once you fix them. Your comps should mirror the renovated condition, not the broken one.
Here’s how you calculate ARV:
- Pull recent comparables: sold in the past three months, within one mile of the subject.
- Match property attributes: beds, baths, square footage (stay within ±20%), lot size, year built, major amenities.
- Inspect the distressed property: document foundation, roof, systems, hazards, and split cosmetic from structural repairs.
- Estimate renovation costs: get contractor bids, itemize scope, add contingencies for permits and surprises.
- Adjust comparables: account for finish differences, upgrades, lot features, school districts, time-on-market.
- Calculate ARV: use adjusted comp prices to set a range. Cross-check with price per square foot and produce low, likely, high ARV estimates instead of one number.
Comparable Sales Analysis Techniques for Distressed Property ARV

Comp-sales analysis is where ARV estimation starts. You find recently sold homes that match your subject’s post-renovation profile, then adjust for size, condition, amenities, and timing differences. The tighter your comps are in space and time, the better your ARV holds up. One study found comps sold within one mile and the same quarter produced a median error of just 2.17 percent. Stretch geography or use stale data and your error bars blow out.
Time and distance rules aren’t negotiable. Use comps from the past three months if you can. 41 percent of agents stick to that window because markets move fast. Keep your search radius under one mile unless you’re out in rural territory with thin inventory. For square footage, stay within ±20 percent of the subject’s size. That keeps median error around 3.87 percent. Stretch too far on any dimension and you’re not analyzing, you’re making stuff up.
Key comp attributes to match:
- Beds, baths, square footage: Core layout drivers. A three-bed comp works for a three-bed subject. Not for a five-bed rehab.
- Year built and construction quality: Older homes have different materials and layouts. Adjust if your subject’s age is way off from comps.
- Amenities and finishes: Central HVAC, updated kitchens, hardwood, granite counters, garage size all shift value. If a comp has upgrades your subject won’t, subtract that premium from the comp’s sale price.
- Lot size and curb appeal: A 0.40-acre lot beats a 0.25-acre lot in most places. Landscaping and street presence count too.
- School district boundaries: Even in the same zip code, school ratings can move value by 10 percent or more. Make sure comps share the same elementary-school zone when possible.
Skip distressed comps entirely. Foreclosures, short sales, pre-renovation flips understate your ARV because they reflect damaged condition, not the upgraded state you’re modeling.
Evaluating the Current Condition of Distressed Homes for ARV Accuracy

Distressed properties come with problems. Some are cosmetic eyesores. Others have expensive structural failures. Severity and type of distress directly affect how much your ARV climbs after repairs. Peeling paint and worn carpet? Light rehab. Foundation cracks and knob-and-tube wiring? Heavy one. Know the difference before you run ARV numbers, or you’ll overestimate value-add and blow your repair budget.
Walk every distressed property and document foundation integrity, roof condition, water intrusion signs, HVAC age and function, plumbing and electrical systems, visible hazards like mold, asbestos siding, lead paint. Foundation repairs run $10,000 to $50,000 depending on severity. Roof replacements average $8,000 to $15,000 for typical single-family homes. Outdated electrical panels and aluminum wiring create cost and safety risk. Hidden problems like buried oil tanks, termite damage, polybutylene plumbing blow up budgets when you skip thorough inspection.
Condition severity shapes how you adjust comps and set your ARV range. If your subject needs a full gut but your comps only had cosmetic updates, their sale prices overstate your ARV unless you subtract the cost and risk of deeper work. On the flip side, if you’re renovating an older home to higher standard than typical neighborhood comps (adding central air where most have window units), you might justify a premium. But only if local buyers will pay for it. Document everything during inspection so contractor bids and ARV adjustments reflect reality, not wishful thinking.
Estimating Rehab Costs to Inform ARV Calculations

Accurate repair-cost estimation is the other half of the ARV equation. You need to know what the house will be worth after work and what it costs to get there. Underestimate costs by 10 percent and profit vanishes. Overestimate and you walk away from good deals. Baseline data helps: the average full-house remodel ran $46,915 in 2021, ranging from $19,800 to $74,400 depending on size and scope. Kitchen remodels averaged $26,522. Bathroom remodels $14,874. Those numbers give you a sanity check when contractor bids arrive.
Start with a detailed scope of work. Walk the property, list every repair and upgrade by room and system, separate cosmetic fixes (paint, flooring, fixtures) from structural or mechanical work (foundation, roof, HVAC, electrical panel). Get bids from at least two or three licensed contractors. Their line-item breakdowns reveal cost differences and help you spot padding or missed items. If one bid skips permit costs or hazardous-material remediation, that’s a red flag. Add a 10 to 20 percent contingency. Old houses hide problems behind walls.
| Repair Category | Typical Cost Range | ARV Impact Consideration |
|---|---|---|
| Kitchen | $15,000 – $35,000 | High-impact; comps with updated kitchens command premium |
| Bathroom | $8,000 – $20,000 per bath | Moderate-impact; multiple baths add more total value |
| Flooring | $3,000 – $10,000 | Cosmetic but visible; hardwood or luxury vinyl boost appeal |
| HVAC | $5,000 – $12,000 | Essential in many markets; absence can kill comps in hot climates |
| Roofing | $8,000 – $15,000 | Must-fix; does not add value but prevents major ARV discount |
Cross-reference contractor bids against these benchmarks and historical invoices from similar projects. If your kitchen bid hits $50,000 but the ARV gain from a renovated kitchen is only $30,000, you’re either overpaying or over-improving for the neighborhood. Remember: renovation costs must stay below value-added. The math has to work before you write the first check.
Incorporating Market Trends and Neighborhood Factors into ARV
ARV is a snapshot, not a guarantee. It reflects what a property should sell for today, or in the next few months, based on current conditions. If the market shifts while you’re holding or renovating, your ARV shifts with it. That’s why ARV calculations are timing-sensitive and vulnerable in volatile conditions. National median home price jumped more than 13.9 percent in 2021. A tailwind that lifted ARVs fast. But if rates spike or inventory floods during your rehab, that same ARV can compress just as quickly.
Neighborhood factors adjust your ARV range even when broader trends hold steady. School district quality, walkability, proximity to employers or amenities, visible neighborhood condition all move buyer demand and willingness to pay. A block with multiple vacant homes or deferred maintenance signals lower demand and slower sales. A block near a top-rated elementary school can command a 10 percent premium over identical houses two streets away. Capture these signals during comp research and property walk-through.
Market and neighborhood factors to monitor:
- Neighborhood desirability and buyer demand: Look for low vacancy, maintained homes, recent sales activity. Avoid blocks with boarded windows or neglected yards.
- Seasonality and inventory levels: Spring and early summer typically see higher sale prices and faster absorption. Winter markets can soften, extending holding time and cutting ARV.
- Days on market trends: If comps sell in under 30 days, you’re in a seller’s market and ARV holds firm. If comps linger 90-plus days, expect downward price pressure.
- Absorption rate and local supply: Track months of inventory on the market. Under three months favors sellers and supports higher ARV. Over six months tilts buyer and might require ARV discount.
When market conditions are uncertain or neighborhood factors vary widely, produce a sensitivity range. Low ARV (if market softens 5 percent), likely ARV (current conditions hold), high ARV (if demand accelerates). That range helps you stress-test profit and decide if the deal survives a downturn.
Modeling Profit Margins and Applying Investment Rules to ARV

ARV anchors every profit calculation. Once you know post-repair sale price, you subtract acquisition cost, renovation cost, holding cost, financing cost, closing and agent fees to see what’s left. If there’s not enough margin to justify risk and time, walk away. Most common shortcut for quick evaluation is the 70 percent rule: your max purchase price should equal 70 percent of ARV minus total repair costs. For example, if ARV is $300,000 and repairs are $50,000, then 70 percent of ARV is $210,000. Your max purchase is $210,000 minus $50,000, which equals $160,000.
Lenders rely on ARV to set loan-to-value limits. Hard-money and rehab lenders typically cap LTV at 65 to 75 percent of ARV. Higher ARV unlocks more financing but doesn’t eliminate need for equity or cash reserves. If your ARV comes in lower than expected, your loan approval might shrink or disappear. That’s another reason to run conservative, verified comps instead of optimistic guesses.
Holding costs add real weight to project expense and tighten profit margins. Expect holding costs to run roughly 1 to 3 percent of property value per month, depending on property taxes, insurance, utilities, interest. If your rehab stretches from three months to six, those costs double and profit margin compresses. Factor them into your ARV-based profit model from day one.
Step-by-step profit modeling using ARV:
- Set your ARV estimate: Use adjusted comps to produce likely ARV and conservative ARV (5 to 10 percent lower).
- Calculate total project cost: Purchase price plus renovation plus holding (estimate months to completion and sale) plus financing (origination, interest, closing fees) plus selling costs (agent commission, closing costs, typically 8 to 10 percent of ARV).
- Subtract total project cost from ARV: The remainder is gross profit.
- Check profit as percentage of ARV: Target at least 15 to 20 percent gross profit margin to absorb surprises and compensate for risk.
- Run sensitivity scenarios: Drop ARV by 5 percent or add one month of holding time. If profit disappears, deal’s too thin.
The 70 percent rule gives you a quick yes-or-no filter. The five-step model gives you the real answer. Use both. Don’t chase deals where math only works if everything goes perfectly.
Common ARV Calculation Mistakes When Evaluating Distressed Properties

Even experienced investors make ARV mistakes when they rush or rely on bad data. Most frequent error is using comps that don’t match the subject property’s post-renovation profile. Pulling foreclosure sales, homes in different school zones, or properties sold six months ago when the market was hotter. One analysis found a median appraisal error of 4.4 percent across residential valuations. That error climbs when comps are poorly chosen or inadequately adjusted. A 5 percent ARV miss on a $300,000 target is $15,000. Enough to erase profit or turn a winner into a loser.
Underestimating repair costs is the second-most-common mistake. Contractor bids can be incomplete, renovation timelines slip, and hidden damage appears once walls are open. Remodeling cost data showed a range from $19,800 to $74,400 for full-home projects. Nearly a four-times spread. If you budget at the low end without inspecting thoroughly or adding contingency, you’ll run out of money mid-project and either have to sell unfinished or inject more capital at lower returns.
Four critical ARV calculation errors and their consequences:
- Using outdated or non-comparable comps: Comps older than three to six months or located outside your one-mile radius introduce valuation drift and miss recent market shifts. Result is an ARV that’s disconnected from current buyer behavior.
- Ignoring condition and amenity adjustments: Failing to subtract value for missing upgrades (comp has granite counters, your subject will have laminate) or add value for superior features inflates or deflates ARV inaccurately.
- Skipping holding-cost estimates: Treating the deal as if you’ll sell the day renovation finishes. Reality is marketing time, showings, negotiations, closing add weeks or months and cost real money.
- Neglecting local market trend analysis: Assuming ARV will hold steady when inventory’s rising, days-on-market are climbing, or interest rates are spiking. ARV is short-term and sensitive to external conditions you can’t control.
Cross-check your work. Pull fresh comps every time you re-evaluate a deal. Verify contractor line items, add contingency, model multiple exit timelines. If you can’t explain every adjustment and assumption in your ARV calculation, you don’t have an ARV. You have a guess.
Distressed Property ARV Case Study and Practical Application

Here’s a realistic example. You’re evaluating a distressed three-bedroom, 2.5-bath home built in 1975 with 2,200 square feet on a 0.30-acre lot. Property needs full interior renovation and central HVAC upgrade. You pull four recently sold comparables within one mile, all sold in the past three months, all three-bedroom homes with similar lot sizes. You build a side-by-side matrix to organize data and calculate price per square foot.
| Comp | Sq Ft | Sale Price | $/Sq Ft | Condition |
|---|---|---|---|---|
| Comp A (1975) | 2,175 | $749,999 | $344.83 | Partially updated |
| Comp B (1998) | 2,330 | $949,500 | $407.51 | Newer, move-in ready |
| Comp C (1975) | 2,200 | $989,999 | $422.72 | Fully renovated |
| Comp D (1970) | 1,990 | $999,500 | $502.26 | Fully renovated, premium finishes |
Comp A is partially updated and older, so it understates your ARV. Comp B is newer construction, which some buyers prefer, but your subject is older. You might not command the same premium. Comp C is closest match. Same year, same size, fully renovated. Its $422.72 per square foot suggests an ARV around $930,000 for your 2,200 square feet. Comp D is smaller but carries premium finishes and higher price per square foot. If you plan similar-quality renovations, you might push toward that range. But verify local buyers will pay the premium before assuming it.
Translating the comp matrix into ARV scenarios:
- Low ARV (conservative case): Use Comp C’s price per square foot ($422.72 × 2,200 = $930,000) and subtract 3 percent for market-timing risk or finish differences. Low ARV approximately $900,000.
- Likely ARV (base case): Weight Comp C and Comp D. If your renovation quality matches Comp C, likely ARV is $930,000 to $950,000. If you add premium finishes closer to Comp D, likely ARV climbs toward $975,000.
- High ARV (optimistic case): If market appreciates modestly during your hold or buyer demand for renovated older homes stays strong, high ARV could reach $990,000 to $999,000, matching Comp C and Comp D sale prices.
Use low and likely ARV numbers to model profit and set max purchase price. If the deal only works at high ARV, you’re betting on best-case outcomes. Risky position for a distressed property with renovation unknowns. Run your 70 percent rule and profit sensitivity against likely ARV. Make sure you can still hit your return target if actual sale comes in at the low end.
Final Words
Use the comp rules and ARV formula we covered to put numbers on a fixer—choose recent sold comps, inspect for structural issues, and itemize rehab costs.
Run the math: estimate repairs, adjust for market trends, and build low/likely/high ARV scenarios. Apply the 70 percent rule and model sensitivity so surprises don’t wipe your profit.
This simple framework for assessing ARV for distressed residential properties helps you avoid bad buys. Do the homework, get solid bids, and you’ll make calmer, smarter offers.
FAQ
Q: What is the 3-3-3 rule in real estate?
A: The 3-3-3 rule in real estate says use three comparable sales within three months and three miles to anchor an ARV estimate for a rehab or distressed property.
Q: How do you calculate the arv of a property?
A: The ARV of a property is calculated by estimating its post-repair market value using recent comparable solds, adjusting for differences, and adding projected value from planned renovations.
Q: What are the red flags for home appraisals?
A: Red flags for home appraisals are non-comparable or outdated comps, large recent price drops, unpermitted work, major structural or water damage, long vacancy, or title and fraud issues.
Q: What is considered a distressed property in real estate?
A: A distressed property is a home sold below normal market terms due to financial, legal, or physical strain, such as foreclosure, short sale, liens, long vacancy, or severe deferred maintenance.