
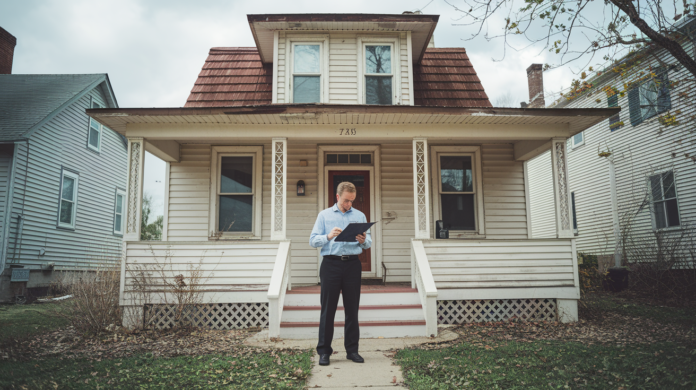
What if a $50,000 “bargain” turns into a $90,000 money pit?
Before you sign, you need a simple ROI framework that shows whether rehab-to-rent makes sense on a distressed house.
This post walks you through the four cost layers – purchase, rehab, holding, financing – then gives a quick-screen formula and a no-nonsense go/no-go checklist.
You’ll learn how to estimate ARV, project cash flow, and stress-test repairs so you can say yes or walk away with numbers, not hope.
Core Framework for Evaluating Rehab-to-Rent Feasibility on Distressed Homes

Rehab-to-rent feasibility tests whether a distressed property can be profitably renovated and turned into a cash-flowing rental. It’s not just “will this rent?” It’s whether the total capital you’ll sink into acquisition, repairs, and stabilization justifies what you’ll earn in income and equity. You’re checking if the spread between your all-in cost and rental value creates positive cash flow and acceptable ROI. If the numbers don’t clear your bar before you close, the deal’s dead.
The feasibility calculation stacks four cost layers: acquisition cost (purchase price plus closing), rehab cost (materials, labor, permits), holding cost (taxes, utilities, insurance during renovation), and financing cost (loan fees, interest, points). Each one compounds the others. A property that looks cheap at purchase can get expensive fast once you add three months of carrying cost and a $40,000 repair bill. Model every dollar that leaves your account before the first rent check shows up.
The profit test pulls from a simple formula: ARV equals the distressed property value plus the value of renovations. Then subtract everything—renovation costs, holding costs, initial investment—from that ARV to calculate net profit. If you’re converting to rental instead of flipping, swap “net profit” for “equity position at stabilization,” then run cash flow projections against your basis to see if the property pays you monthly.
Start with inspection-driven cost discovery. Move to conservative contractor estimates (always use the maximum quote when they give you a range). Run comparative market analysis to validate ARV and rent potential. Make a final go/no-go decision based on ROI and cash-on-cash return. If any single input breaks your model—repair cost, rent estimate, holding period—you walk. This isn’t about optimism.
Property Condition Assessment for Distressed Homes

A full property condition assessment turns guesswork into line items. Hire a licensed home inspector to produce a detailed walkthrough covering every major system and defect. That report becomes your scope of work, which drives your renovation budget, which determines feasibility. Skip the inspection or rely on a “gut feel” walk, and you’re modeling fiction. The assessment also gives you contractor referrals and a prioritized repair list, both of which speed up the estimate phase.
Inspect and document these systems:
- Foundation and structural framing (cracks, settling, load-bearing walls)
- Roof condition and remaining lifespan (shingles, flashing, decking, leaks)
- Electrical panel, wiring, code compliance (knob-and-tube, aluminum, service amperage)
- Plumbing system (galvanized pipes, sewer line condition, water pressure, fixtures)
- HVAC system age and function (furnace, AC unit, ductwork, thermostats)
- Windows and exterior envelope (air leaks, broken seals, siding, insulation)
After the inspection, separate cosmetic repairs from structural or system-level work. Cosmetic fixes (paint, flooring, countertops) are predictable and lower risk. Structural issues (foundation settling, roof replacement, sewer line collapse) carry high cost variance and can kill feasibility if you underestimate them. Prioritize fixing structural problems first in your budget model, then layer in cosmetic upgrades only if cash flow supports it. If the foundation needs $25,000 and your budget is $30,000 total, you don’t have room for granite counters.
Building an Itemized Rehab Budget for Rental Conversion
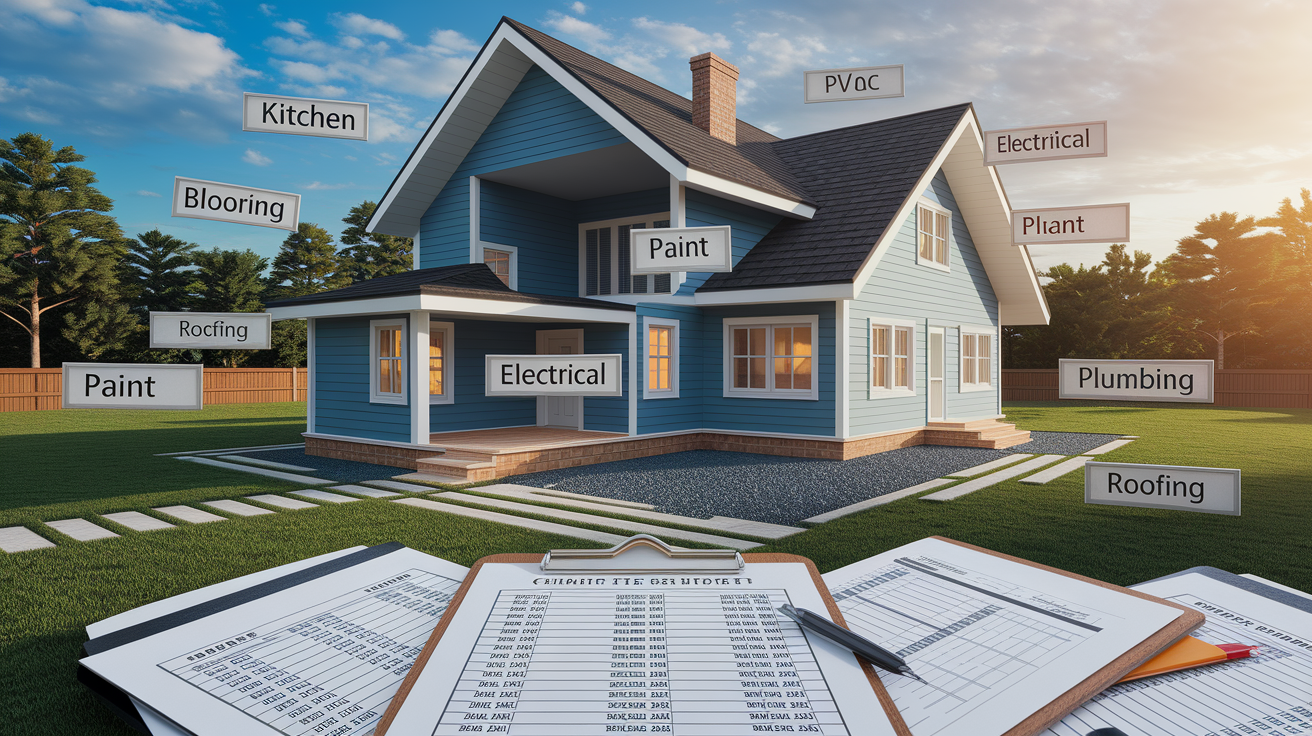
An itemized rehab budget breaks the scope of work into discrete categories with separate cost estimates for materials and labor. Each line item should reference the inspection report or contractor quote. Categories typically include kitchen (cabinets, countertops, appliances), bathrooms (tile, vanities, fixtures), flooring (carpet, LVP, refinishing), paint (interior and exterior), electrical (panel upgrade, outlets, lighting), plumbing (water heater, fixture replacement, drain work), HVAC (unit replacement, duct cleaning), roofing, windows, and exterior work (siding, landscaping, driveway).
Collect at least three bids per major category. If a contractor gives you a price range (say $8,000 to $12,000 for a bathroom remodel), use the $12,000 figure in your projection. The high end protects your margin when unforeseen conditions appear, which they almost always do. If the final invoice comes in at $9,500, you just created a $2,500 buffer. If it hits $12,000, your model still works. Never underwrite to best-case pricing.
Add a contingency line equal to 10 to 15 percent of total hard costs. Distressed properties hide problems behind drywall, under flooring, and inside walls. You’ll find rotted subfloor when you pull up carpet, or discover that the “working” furnace is actually a safety hazard. Contingency isn’t pessimism, it’s arithmetic. Prioritize spending on kitchens and bathrooms, which drive the most rent and resale value. The living room often needs only a fresh coat of paint and mid-price flooring. Granite and stainless finishes boost perceived quality, but they rarely move the rent needle enough to justify premium cost in a rental conversion.
| Category | Typical Items | Cost Sensitivity Level |
|---|---|---|
| Kitchen | Cabinets, countertops, appliances, backsplash | High |
| Bathrooms | Tile, vanities, toilets, tubs, fixtures | High |
| Flooring | Carpet, LVP, hardwood refinish, tile | Medium |
| Major Systems | HVAC, electrical panel, water heater, roof | High (variable) |
| Cosmetic Finishes | Paint, trim, lighting, hardware, landscaping | Low |
Calculating ARV and Rental Potential for Rehab-to-Rent Projects
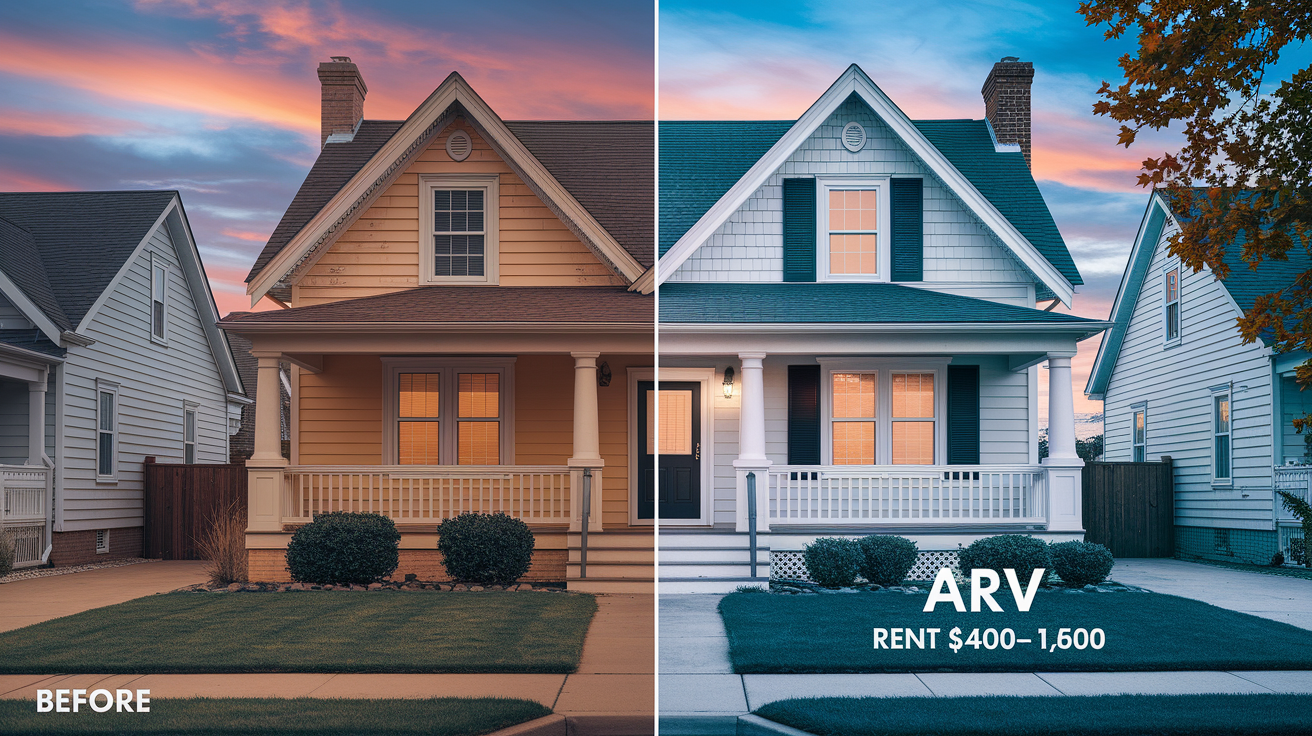
ARV is the estimated market value of the property after all renovations are complete. The formula is simple: ARV equals the current distressed value plus the value added by renovations. In practice, calculate ARV by running a comparative market analysis using recently sold properties in good condition. Look for comps that match the subject property’s neighborhood, number of bedrooms and bathrooms, square footage, lot size, age, and major features like pools or garages. Ignore distressed sales, they don’t reflect post-rehab value.
Pull rental comps the same way you pull sales comps. Search for active listings and recently rented properties with similar bed/bath count, square footage, and condition in the same neighborhood or zip code. Adjust for differences in finishes, amenities, and location quality. If comparable rentals are leasing for $1,400 to $1,600 per month, use $1,400 in your model and assume a 5 to 8 percent vacancy factor annually. That’s conservative. When given a range, model to the lower end for rent and the higher end for expenses.
Good comps share these traits:
- Same neighborhood or immediate submarket
- Matching bedroom and bathroom count
- Within 10 to 15 percent of square footage
- Similar lot size and outdoor space
ARV and rent drive feasibility together. ARV determines how much equity you create at stabilization. Rent determines whether monthly cash flow covers debt service, operating expenses, and reserves. If ARV is $180,000 and your all-in cost is $150,000, you’ve created $30,000 in equity. If rent is $1,500 and your PITI (principal, interest, taxes, insurance) plus operating expenses total $1,600, you’re losing $100 per month. That’s not feasible unless appreciation or tax benefits justify the negative carry.
Operating Expenses, Holding Costs, and Financing Impact on Rehab-to-Rent Feasibility

Operating expenses include property taxes, insurance, utilities (if you cover them), property management, routine maintenance, and reserves for capital expenditures like roof or HVAC replacement. Estimate property taxes using the county assessor’s site and the post-rehab assessed value, not the distressed purchase price. Insurance premiums vary by location, age, and condition. Get a quote before you model. Budget 8 to 12 percent of gross rent for ongoing maintenance and another 5 to 10 percent for vacancy, even in strong markets.
Holding costs accrue during the renovation period before rent starts. These include mortgage interest (if financed), property taxes, utilities to keep systems running, and insurance. If rehab takes four months and your monthly carry is $1,200, that’s $4,800 in sunk cost before you see income. Holding cost extends your breakeven timeline and increases total project cost. Model it explicitly. If you’re using a hard money loan at 10 percent interest and two points, holding cost climbs fast.
When evaluating financing options, model these variables in detail:
- Interest rate and whether it’s fixed or adjustable
- Loan-to-value ratio and down payment requirement (LTV)
- Points, origination fees, and closing costs
- Term length and amortization schedule
- Prepayment penalties or refinance restrictions
Financing distorts feasibility if your debt service ratio is too high. DSCR (a lender’s way of checking if rent covers the payment) should be at least 1.25 for stability. If your annual NOI is $12,000 and annual debt service is $11,000, your DSCR is 1.09. Too tight. Lenders want proof that rent exceeds payment by a comfortable margin, and so should you. Rate changes, even small ones, can flip a deal from positive to negative cash flow when leverage is high.
Running Cash Flow, ROI, and Break-Even Analysis for Distressed Rehab Projects

Cash flow is gross rent minus operating expenses minus debt service. Net operating income (NOI) is gross rent minus operating expenses, but before debt service. It measures property performance independent of financing. Cash-on-cash return is annual cash flow divided by total cash invested, expressed as a percentage. If you invest $50,000 and generate $4,000 in annual cash flow, your cash-on-cash return is 8 percent. ROI can include equity buildup and appreciation, but cash-on-cash isolates actual cash returned to you each year.
Cap rate is NOI divided by property value or purchase price. It’s a snapshot metric that compares yield across properties without factoring in financing. A cap rate of 7 percent means the property generates $7,000 in NOI per year for every $100,000 of value. Cap rate helps you screen deals quickly, but it doesn’t tell you if the deal cash flows after debt service. Break-even analysis calculates the minimum rent required to cover all expenses and debt payments with zero cash flow. If your break-even rent is $1,350 and market rent is $1,400, you have a $50 margin. Thin, but workable.
| Metric | Formula | Decision Threshold |
|---|---|---|
| Cash Flow | Gross Rent − Operating Expenses − Debt Service | Positive, ideally $200+ per month |
| Cash-on-Cash Return | Annual Cash Flow ÷ Total Cash Invested | Minimum 6–8%, target 10%+ |
| Cap Rate | NOI ÷ Purchase Price or ARV | Varies by market; compare to local averages |
| DSCR | NOI ÷ Annual Debt Service | Minimum 1.25 |
| Break-Even Rent | (Operating Expenses + Debt Service) ÷ 12 | Should be 10–15% below market rent |
Most buy-and-hold investors prioritize cash flow and cash-on-cash return because those metrics reflect monthly income and liquidity. Cap rate and equity buildup matter for long-term wealth, but if the property bleeds cash every month, you won’t make it to year five. Run sensitivity tests. What happens if rent drops 10 percent, or if vacancy hits 15 percent, or if interest rates rise on your next refi? If any single variable flips the deal to negative, the margin is too thin.
Example Walkthrough: Full Rehab-to-Rent Feasibility Calculation

You find a three-bedroom, two-bathroom distressed property listed at $95,000 in a neighborhood where renovated comps sell for $180,000 and rent for $1,500 per month. The home needs a full rehab. Kitchen, both bathrooms, flooring, paint, HVAC replacement, and minor electrical work. Closing costs are $3,000. You plan to finance with a conventional loan requiring 20 percent down ($19,000) at 7 percent interest over 30 years.
After inspection, you build a detailed repair list and collect contractor quotes. Kitchen remodel (cabinets, counters, appliances): $12,000. Bathroom updates (tile, vanities, fixtures): $8,000. Flooring throughout (LVP): $5,000. Interior and exterior paint: $4,000. HVAC replacement: $6,500. Electrical panel upgrade and outlets: $2,500. Miscellaneous (landscaping, minor plumbing, cleaning): $3,000. Subtotal hard costs: $41,000. Add 12 percent contingency ($4,920) for a total rehab budget of $45,920. Renovation timeline is estimated at three months, during which you’ll pay property taxes ($200/month), insurance ($100/month), and loan interest on $76,000 at 7 percent annually (roughly $442/month). Total holding cost: $2,226.
Your all-in cost is purchase price ($95,000) plus closing costs ($3,000) plus rehab ($45,920) plus holding costs ($2,226), which equals $146,146. Estimated ARV is $180,000, creating $33,854 in equity at stabilization. Monthly rent projection: $1,500. Operating expenses: property taxes ($200), insurance ($120), property management at 8 percent ($120), maintenance reserve ($120), vacancy reserve at 6 percent ($90). Total operating expenses: $650. Monthly debt service on a $76,000 loan at 7 percent over 30 years: $506. Monthly cash flow: $1,500 minus $650 minus $506 equals $344.
Annual cash flow is $4,128. Total cash invested (down payment plus rehab plus holding cost): $19,000 plus $45,920 plus $2,226 equals $67,146. Cash-on-cash return: $4,128 divided by $67,146 equals 6.15 percent. DSCR: ($1,500 minus $650) times 12 divided by ($506 times 12) equals 1.68. The deal is feasible. It generates positive monthly cash flow, meets the DSCR threshold, and creates equity. If rehab cost climbed to $55,000 or rent dropped to $1,350, feasibility would be marginal. This is why conservative inputs matter.
Risk Management and Common Errors When Evaluating Distressed Rehab-to-Rent Deals

The biggest mistakes in rehab-to-rent feasibility stem from optimistic assumptions and incomplete cost accounting. Overestimating ARV by using comps that aren’t truly comparable (different neighborhoods, larger square footage, superior condition before renovation) creates phantom equity that disappears at appraisal. Underestimating rehab costs by skipping the inspection or using rough per-square-foot rules instead of line-item quotes turns a profitable deal into a cash trap. Ignoring holding costs or assuming a two-month rehab will finish on time adds thousands in unexpected carry.
Another common error is underwriting to best-case rent without accounting for vacancy, turnover costs, or tenant quality. If you model 100 percent occupancy at top-of-market rent, the first vacancy or rent concession wipes out your margin. Always stress-test the deal. If rent comes in 10 percent lower, or if renovation runs 15 percent over budget, does the deal still work? If the answer is no, you’re one surprise away from a break-even property.
Typical failure points:
- Using inflated ARV comps that don’t match bed/bath count, square footage, or neighborhood
- Underestimating rehab costs by using contractor “best guess” instead of formal bids with contingency
- Ignoring holding costs like taxes, insurance, and loan interest during renovation
- Modeling zero vacancy or assuming immediate rent-up after rehab completion
- Overlooking hidden systems issues (foundation, roof, electrical, plumbing) that inspection would catch
Budget for maintenance reserves even in new-rehab properties. Systems still fail, tenants still cause damage, and roofs still need replacement eventually. Set aside 5 to 10 percent of gross rent monthly in a capital expenditure reserve. Also model tenant turnover cost (cleaning, minor repairs, lost rent between tenants) at least once every two to three years. If your cash flow margin is $200 per month and a single turnover costs $2,000, you’ve just wiped out ten months of profit.
Decision Criteria and Exit Strategies for Rehab-to-Rent Investors

The go/no-go decision comes down to whether the deal meets your return thresholds and risk tolerance after conservative modeling. Set minimum criteria before you analyze deals. Something like positive cash flow of at least $150/month, cash-on-cash return above 7 percent, DSCR of 1.25 or higher, and total equity creation of at least 15 percent of ARV. If the property clears all four, it qualifies. If it misses even one, walk unless you have a specific strategic reason to accept lower returns (like portfolio diversification or a planned value-add phase two).
Your timeline and exit strategy shape feasibility. A long-term hold strategy values cash flow and equity buildup over immediate profit, so a 6 percent cash-on-cash return might be acceptable if rent growth and appreciation are strong. A shorter-term strategy (hold for three to five years, then refi or sell) requires higher equity creation at stabilization to justify the effort and capital lockup. Tax benefits like depreciation improve effective return, but they don’t pay the mortgage if cash flow is negative.
Potential exit strategies for rehab-to-rent deals:
- Long-term hold: Rent the property indefinitely, capture cash flow, equity buildup, appreciation, and tax benefits.
- Cash-out refinance: After stabilization, refinance based on ARV to pull equity out while keeping the rental income.
- Flip after seasoning: Hold the property as a rental for 12 to 24 months to establish income history, then sell at ARV to a retail buyer.
- Wholesale or assign: If feasibility is marginal for you but strong for another investor, assign the contract or sell the renovated property to another landlord.
If the numbers work and the property clears your thresholds, you have a repeatable deal structure. If they don’t, no amount of optimism will fix the math. The feasibility calculation protects you from hope-based investing. Run it early, run it conservatively, and trust the output.
Final Words
Run a quick feasibility screen: full inspection, prioritized scope, conservative contractor bids, and ARV = distressed value + value of renovations. Then layer in acquisition, rehab, holding, and financing costs for a rough profit test.
We walked through condition assessment, itemized rehab budgets, rent comps, operating expenses, and break-even checks to help you with calculating rehab-to-rent feasibility for distressed homes.
Use the checklists, stress-test your numbers, and favor deals with margin for surprises. Doable with clear rules and realistic expectations—go take the next step.
FAQ
Q: How to estimate a renovation project?
A: Estimating a renovation project means creating an inspection-driven, itemized scope, getting conservative contractor bids for labor and materials, adding permits and 10–20% contingency, and factoring holding time and utilities into total cost.
Q: How to calculate adjusted cost basis rental property?
A: Calculating adjusted cost basis for a rental property is taking purchase price plus acquisition costs and capital improvements, then subtracting accumulated depreciation and qualified casualty losses to determine taxable gain or loss.
Q: What are rehab costs in real estate?
A: Rehab costs in real estate are the hard and soft expenses for restoring or upgrading a property – materials, labor, permits, inspections, contractor overhead, debris removal, design fees, plus contingency and holding interest during work.
Q: What is a rehab budget?
A: A rehab budget is an itemized forecast of every repair and upgrade cost – line-item estimates, permit and contractor max bids, a contingency reserve, and timing-based holding costs to size funding and protect cash flow.