

Think house hacking always makes cash flow look great? Not if you forget taxes, repairs, vacancy, and management.
A house hacking cash flow calculator takes your numbers and shows what really stays in your pocket each month.
This post walks you through the calculator inputs, a worked example, and smart budgeting moves like reserves, conservative estimates, and tenant screening, so you can pressure-test deals fast.
By the end you’ll know the quick screen and the budgeting steps that keep a house hack from turning into a money sink.
Complete House Hacking Cash Flow Calculator Overview

A house hacking cash flow calculator takes your property’s numbers and shows exactly how much money stays in your pocket each month after all expenses. It calculates your monthly cash flow (rent minus all costs) and your cash-on-cash return (how much your invested dollars earn each year). If you’re renting out a room for $800 and your mortgage is $1,500, you might think your net cost is just $700. But the real picture includes taxes, insurance, vacancy months, and repairs you haven’t thought about yet.
The calculator needs specific inputs to give you useful output. You’ll enter the purchase price, down payment percentage, interest rate, property taxes (often around 0.85% of property value annually), insurance (roughly 1% of value), your rent estimate, vacancy rate (typically 5%), repairs and capital expenditures (usually 10% of rent), and property management fees (8 to 10% even if you’re managing yourself). For example, on a $200,000 property with 3.5% down at 5.5% interest, your principal and interest payment runs $1,176 per month. Add $141 for taxes, $167 for insurance, and suddenly the numbers look different.
When you model rent at $2,000 per month and subtract $1,176 for P&I, $141 for taxes, $167 for insurance, $160 for management (8%), $100 for vacancy (5%), and $200 for repairs (10%), your net monthly cash flow lands at $56. That’s not much cushion. But it means the property carries itself while you live there. Your total cash invested is $7,000 down plus $5,000 closing costs, which equals $12,000, producing an annual cash flow of $672 and a cash-on-cash return of 5.6%. If the seller covers closing costs, your return jumps to 9.6% because you only invested $7,000.
Required calculator inputs:
- Property purchase price
- Down payment percentage
- Interest rate and loan term
- Annual property tax (percentage or dollar amount)
- Annual insurance cost (percentage or dollar amount)
- Estimated monthly rental income
- Vacancy allowance percentage
- Repairs and CapEx percentage
- Property management percentage
Practical Expense Breakdown for House Hacking Cash Flow
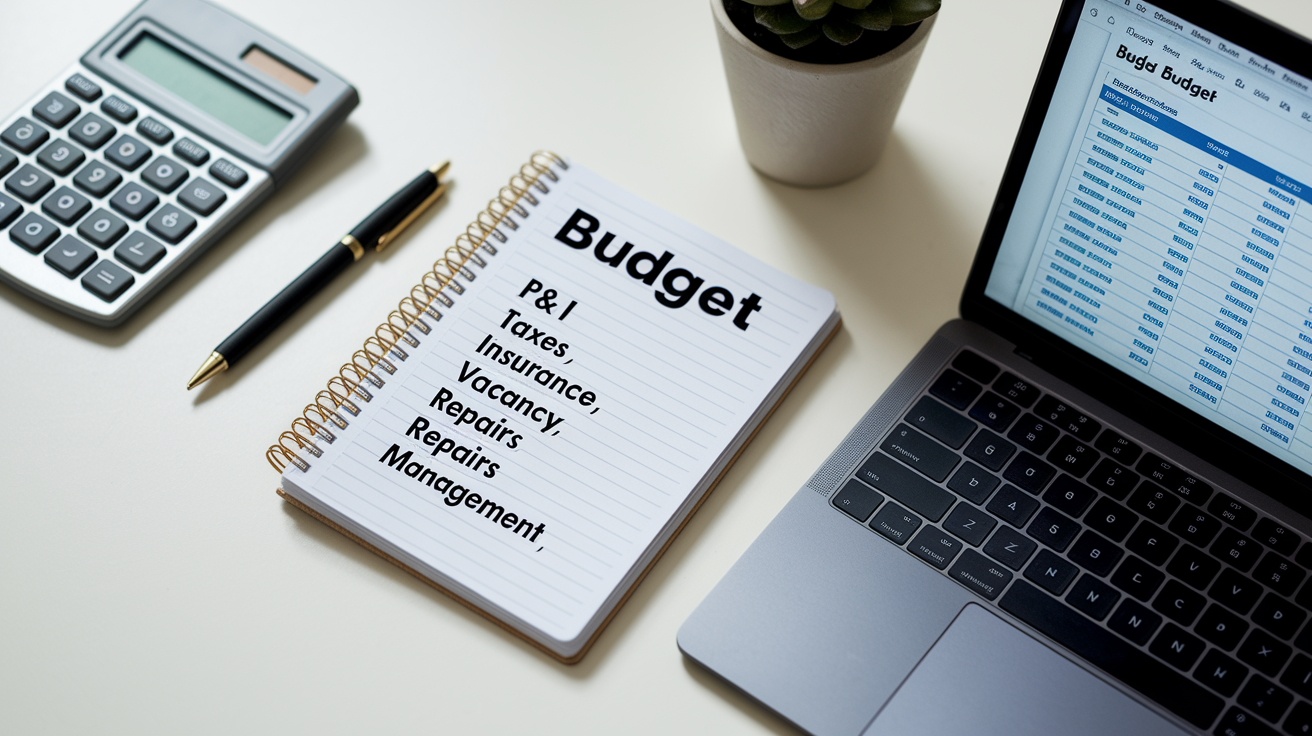
Every expense category chips away at your rental income, so understanding each line matters when you’re pressure testing a deal. Your mortgage principal and interest payment is the biggest fixed cost. In the $200,000 example, that’s $1,176 every month, rain or shine. Property taxes typically run 0.85% to 1.5% of property value annually depending on location. In this case $1,700 per year translates to $141 per month. Insurance averages about 1% of property value, though Florida and coastal markets can run much higher. Budget $2,000 annually, or $167 monthly, and get real quotes during due diligence.
The variable costs are where beginners make mistakes. Property management should be modeled at 8 to 10% of rent even if you’re self managing, because your time has value and you might hire help later. Vacancy sits at 5% to cover turnover months when you’re between tenants or doing light rehab. Repairs and capital expenditures get lumped at 10% in simple models, though some investors split it into 10% repairs and another 5 to 10% for big ticket CapEx like roofs and HVAC. Older homes need more. Newer construction less. Then add any HOA dues, owner paid utilities if tenants don’t cover them, and lawn or pest control if applicable.
| Expense Category | Typical % or Amount | Example Monthly Cost |
|---|---|---|
| Principal & Interest (P&I) | Varies by loan terms | $1,176 |
| Property Taxes | 0.85–1.5% annually | $141 |
| Insurance | ~1% annually | $167 |
| Vacancy Allowance | 5% of rent | $100 |
| Repairs & CapEx | 10% of rent | $200 |
| Property Management | 8–10% of rent | $160 |
Revenue Forecasting for House Hackers

Estimating rental income starts with local rent comparables. Pull recent listings for similar rooms or units in your neighborhood and adjust for differences in amenities, parking, utilities included, or furnishings. If you’re renting a bedroom in a shared house, check what other rooms go for within a half mile radius. One common house hacking example is renting a single room for $800 per month, modest but realistic in many mid tier markets. If you’re converting a basement apartment or renting a whole unit in a duplex, your rent estimate might hit $2,000 or more depending on square footage and location.
The 1% rule is a quick screen. Monthly rent should equal roughly 1% of the purchase price. A $200,000 property charging $2,000 in rent passes that test, though it’s not a guarantee of strong cash flow once expenses pile on. Factor in what utilities or internet you’ll cover versus what the tenant pays. If you include utilities, you can charge slightly higher rent but your net may stay flat. Be realistic about market demand. If comparable rooms sit vacant for weeks, your pricing is probably too high. Update your rent estimate as you gather better data from brokers, property managers, or online rent estimate tools that pull recent comparable transactions.
Key rent pricing factors:
- Location and neighborhood quality
- Amenities (parking, laundry, yard access)
- Utilities and internet included or separate
- Furnished versus unfurnished
- Local market demand and vacancy trends
For a practical look at how rent setting fits into the overall house hacking strategy, see Understanding House Hacking.
Budgeting Tips to Maximize House Hack Cash Flow

Conservative assumptions protect you when reality doesn’t match the spreadsheet. Use the higher end of expense ranges until you have verified numbers. Model property management at 10% even if you plan to self manage. It values your time and prepares you for the day you want to hire out. Assume vacancy at 5% minimum. If you think you’ll fill the space instantly, you’re probably underestimating turnover friction. Budget repairs at 10% of rent or higher for older properties, because the water heater and HVAC don’t care about your cash flow forecast.
Reserves are what keep your budget from failing when something breaks. Set aside the vacancy and repair allowances in a separate account each month. If you collect $2,000 in rent, bank $100 for vacancy and $200 for repairs before you spend a dollar elsewhere. That $300 per month becomes your maintenance and turnover fund. When a tenant moves out and you repaint or replace carpet, you pull from reserves instead of your personal savings. Emergency funds should cover at least three months of total property expenses in case rent stops or a major repair hits.
Turnover costs more than most new landlords expect. Every time a tenant leaves, you lose rent during the vacancy, pay for cleaning or small repairs, and spend time screening the next person. You can reduce turnover by being responsive to maintenance requests, keeping communication clear, and pricing rent fairly so good tenants stay longer. Automate rent collection and maintenance tracking to avoid the chaos of missed payments or forgotten work orders. Operational discipline compounds into better cash flow over time. Run the property like a business even when it’s your home. Consistently screen tenants, document everything, and track your numbers.
Six budgeting moves to strengthen cash flow:
- Model all expenses at conservative estimates until verified.
- Maintain separate reserves for vacancy and repairs.
- Include property management cost even if self managing.
- Screen tenants carefully to reduce turnover and late payments.
- Automate rent collection and maintenance requests.
- Track every dollar of rental income and expenses for tax accuracy.
Case Study: Worked House Hacking Cash Flow Example

Let’s walk through the $200,000 house hack using an FHA loan with 3.5% down at 5.5% interest over 30 years. Your down payment is $7,000. Closing costs run another $5,000, so total cash invested is $12,000. The monthly principal and interest payment comes to $1,176. Property taxes are estimated at 0.85% of value annually, which equals $1,700 per year or $141 per month. Insurance runs about 1% of property value, so $2,000 annually or $167 per month.
You estimate market rent at $2,000 per month, which meets the 1% rule and matches recent comps for similar units in the area. Property management takes 8% of rent, or $160 per month. Vacancy allowance at 5% is another $100. Repairs and capital expenditures at 10% of rent equal $200 per month. Subtract all operating costs from gross rent and you land at a net monthly cash flow of $56. That’s tight. But it means the property supports itself while you live there and covers costs when you move out.
Your annual cash flow is $56 times 12, or $672. Divide that by your $12,000 cash investment and you get a cash on cash return of 5.6%. If the seller agrees to pay your closing costs, your out of pocket drops to $7,000 and your cash on cash return jumps to 9.6%. Beyond the monthly cash flow, you’re also paying down the mortgage. In year one, roughly $2,734 of your payments go toward principal. If the property appreciates conservatively at 2.5% per year, that’s another $5,000 in equity gained. Total annual return from cash flow, mortgage paydown, and appreciation adds up to about $8,406. That’s nearly 70% of your initial $12,000 investment in the first year alone.
| Line Item | Monthly Amount |
|---|---|
| Gross Rent | $2,000 |
| Principal & Interest | –$1,176 |
| Property Taxes | –$141 |
| Insurance | –$167 |
| Property Management (8%) | –$160 |
| Vacancy Allowance (5%) | –$100 |
| Repairs & CapEx (10%) | –$200 |
| Net Monthly Cash Flow | $56 |
Long Term Budgeting & Cash Flow Projections for House Hackers

Today’s $56 monthly cash flow might not look impressive, but compounding returns over 20 years tell a different story. If you only count cash flow and mortgage principal paydown (ignoring appreciation), you accumulate more than $67,000 on your original $12,000 investment. Add in conservative 2.5% annual appreciation and that total climbs to roughly $168,000 over two decades. The real power isn’t the monthly check. It’s the equity you’re building while someone else pays your mortgage.
Mortgage principal reduction accelerates as the loan ages. Early payments are mostly interest, but by year ten a bigger chunk goes to principal each month. That equity becomes accessible for refinancing into better terms, pulling cash out for the next investment, or simply holding as a wealth cushion. If interest rates drop, refinancing can lower your payment and boost monthly cash flow without changing the property. Rent growth adds another layer. Even modest 2 to 3% annual increases compound into meaningful income over a decade.
Five long term cash flow drivers:
- Mortgage principal paydown (accelerates over time)
- Property appreciation (2 to 5% annually depending on market)
- Rent growth (typically 2 to 4% per year)
- Refinancing opportunities when rates improve
- Growing reserves that reduce surprise expense impact
Templates, Tools, and Spreadsheet Options for House Hack Cash Flow
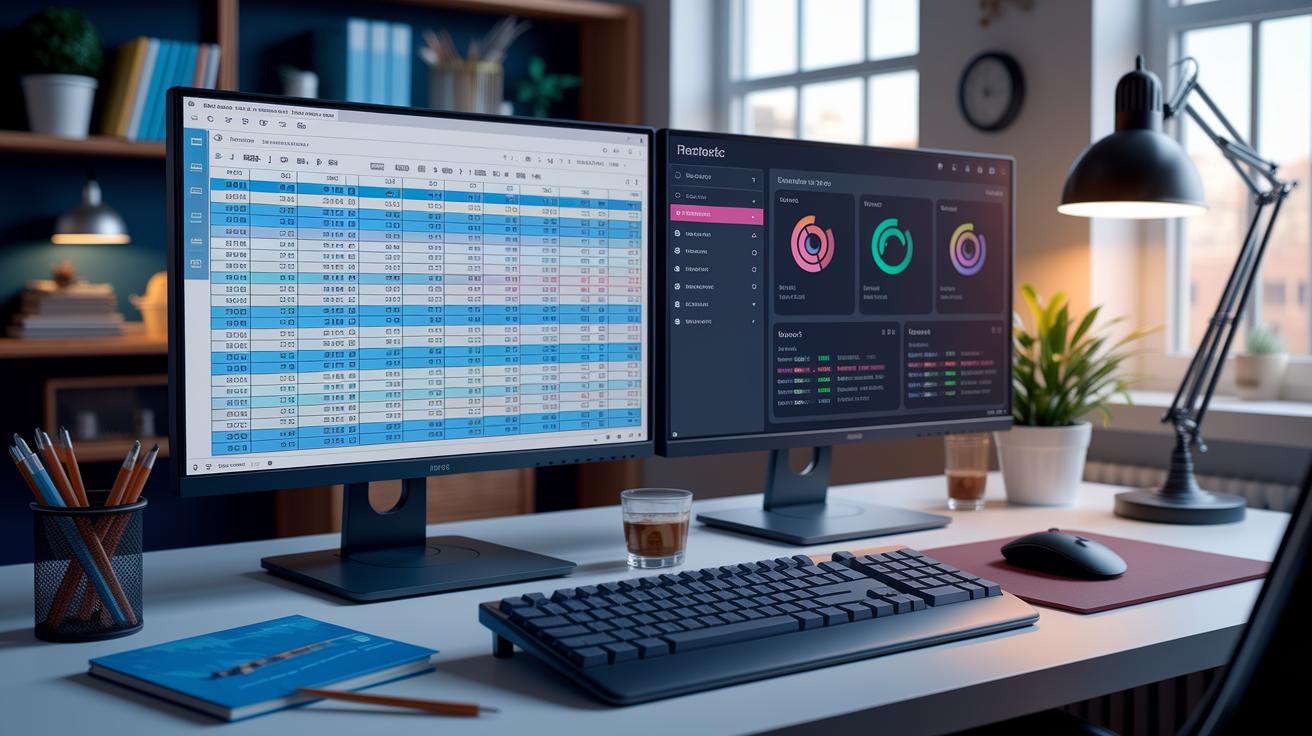
Spreadsheets work fine for a single property if you’re comfortable with formulas and manual updates. You control every cell, customize calculations, and don’t pay monthly fees. The downside is data entry takes time, formulas break when you edit carelessly, and there’s no automatic sync with your bank or rent payments. You’ll need to track income and expenses separately, then reconcile everything by hand each month. Export to your accountant at tax time means cleaning up six tabs of inconsistent formatting.
Software like Rentastic automates most of that friction. The platform includes a Profit & Loss Statement, Cash Flow Report, Rent Estimates using local comps, a Mortgage Calculator, and a Deal Analyzer that runs cash flow and ROI scenarios in seconds. Bank account integration pulls transactions automatically, so you’re not typing every expense twice. Tenant screening, rent collection, and maintenance tracking live in the same dashboard, and you can export clean reports for tax prep without wrestling pivot tables. The tradeoff is a subscription cost. But if your time has value and you plan to scale beyond one property, the automation pays for itself quickly.
For more on how property management tools support house hacking workflows, see Rentastic Tools for Property Management.
| Feature | Spreadsheet | App/Software |
|---|---|---|
| Data Entry Effort | High (manual input) | Low (bank sync, auto fill) |
| Automation | Minimal (formulas only) | High (rent collection, reports) |
| Error Risk | Moderate (formula mistakes) | Low (built in validation) |
| Exportability | Flexible but messy | One click clean reports |
| Tax Prep | Requires manual cleanup | Automatic summaries, deduction tracking |
Final Words
Run the numbers now: plug purchase price, down payment, rate, taxes, insurance, rent, vacancy, repairs and management into the calculator to see monthly cash flow and cash-on-cash return.
This post showed the calculator parts, expense breakdown, rent forecasting, budgeting moves, a worked $200k example, long-term projections, and tools to track results.
Keep assumptions conservative, hold reserves, and stress-test for vacancy or higher repairs. Use the house hacking cash flow calculator and budgeting tips to make steady, low-regret choices. You’ll have clearer next steps.
FAQ
Q: What does a house hacking cash flow calculator do and what metrics does it output?
A: The house hacking cash flow calculator estimates monthly net cash flow and returns like cash-on-cash, plus payment breakdowns (P&I), reserves needed, and simple profit-and-loss projections for owner-occupied rentals.
Q: What inputs do I need for the calculator?
A: The required inputs are purchase price, down payment %, interest rate, taxes, insurance, projected rent, vacancy %, repairs/CapEx %, and property management %.
Q: How do these inputs translate into real monthly net cash flow using the $200,000 example?
A: Using the $200,000 example, inputs produce P&I $1,176, taxes $141, insurance $167, rent $2,000, management $160, vacancy $100, repairs $200, yielding about $56 net monthly cash flow.
Q: How should I budget recurring expenses and what are typical amounts?
A: Budget recurring expenses by modeling P&I, taxes (~0.85% of price), insurance (~1%), vacancy (5%), repairs/CapEx (10%), and management (8–10%); adjust for HOA, utilities, or local cost differences.
Q: How do I estimate rental income for rooms, units, or medium-term rentals?
A: Estimate rental income by checking local comps, adjusting for room size and amenities; tools can suggest rents, like $800 for a room or $2,000 for a full-unit example.
Q: What budgeting tips help maximize house hack cash flow?
A: To maximize cash flow, use conservative rent and expense estimates, keep reserves for vacancy and CapEx, automate rent collection, screen tenants, and value time when choosing self-management versus paid management.
Q: What does a worked case study show about returns and cash invested?
A: The worked case shows $56 monthly net, $672 annual; $12,000 cash invested yields 5.6% cash-on-cash, while seller-paid closing reduces investment to $7,000 and raises return to about 9.6%.
Q: How do long-term projections affect house hack returns?
A: Long-term projections show principal paydown, modest appreciation (2.5% assumed), and rent growth drive returns; over 20 years paydown plus flow can exceed $67,000, or about $168,000 including appreciation.
Q: Should I use a spreadsheet or an app for house hack cash flow tracking?
A: Choose spreadsheets for low cost and control; pick apps for automation, rent collection, tenant screening, and exportable reports; weigh data-entry effort, error risk, and tax-prep needs.